The weather experienced over the past year and a half to two years has been extreme in both meteorological and climatological terms, with increasing precipitation deficits across much of the northern hemisphere in the second half of 2021. This culminated in several months of above-average heat in the summer of 2022, a drought unseen in 450 years, an extraordinarily mild early winter in Europe and historical snowstorms in North America. The extreme shift in the weather system has been caused by a combination of climate change and its impact on circulation, the negative anomaly of the Eastern Pacific Ocean (La Niña), together with local and specific climatological effects, as well as hydrological and soil properties. La Niña is weakening and is likely to be increasingly replaced in the second half of 2023 by its “sister” climatological phenomenon – El Niño – in the Central and Eastern Pacific, which accounts for a third of the Earth’s water resources. Should it persist for as long as La Niña, which began in 2020, it could even affect weather conditions in Hungary.
Due to climate change, the seasons of winter, spring and fall have become far milder and summers have become far warmer in Europe. 2023 is also expected to be one of the hottest years on record due to intense warming, with extremes varying from region to region.
What are El Niño and La Niña? What are their impacts globally and on the European region? To what extent does this year’s (2023) weather depend on them? These are the questions explored by the present study.
I. El Niño – La Niña
Under normal conditions, trade winds blow across the tropical Pacific from east to west along the equator, carrying warm ocean surface waters from South America to Asia. The Humboldt Current transports cold, oxygen-rich water from the South Pacific northward to the tropics, where it gradually rises close to the surface off the coast of Peru. Through the trade winds, this cold water flows westward along the equator, where it is slowly warmed by the sun. As a direct result, sea surface temperatures in the western Pacific are generally warmer than in the eastern Pacific, with a difference of about 8-10 degrees Celsius. This warmer part of the ocean is a source of convection (atmospheric upwelling), associated with heavy cloud formation and extreme precipitation. In El Niño years, the cold water flow weakens or disappears completely as the water in the central and eastern Pacific becomes as warm as the western Pacific (Figure 1).
This multi-million year process, referenced in specialist literature as the El Niño-Southern Oscillation (ENSO) cycle, is often interrupted. In each period, ENSO fluctuates between three temperature phases: neutral or normal; La Niña (cold) and El Niño (warm).
Both El Niño and La Niña can affect global atmospheric conditions, weather, ecosystems and the economy.
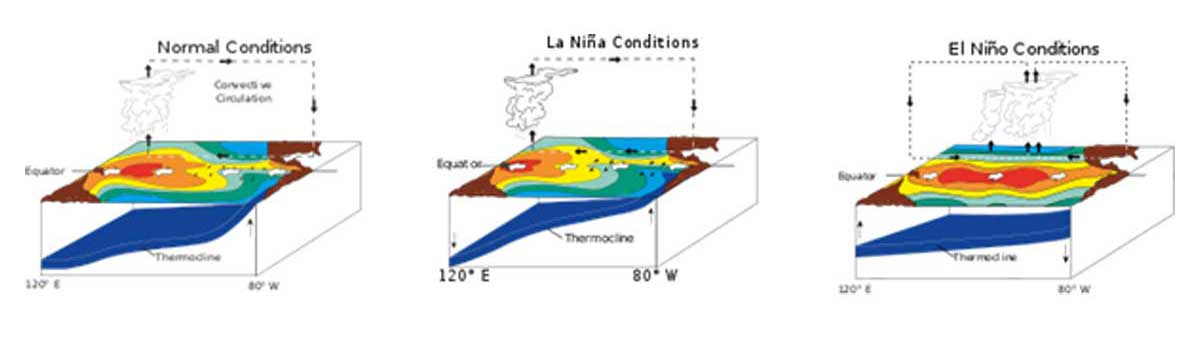
Figure 1: ENSO phases: normal (left), La Niña (center), La Niña (right). The figure shows that normal and La Niña phases often reflect a similar pattern. Source: Pacific Marine Environmental Laboratory/NOAA
El Niño is a macro-scale ocean and atmospheric climate phenomenon experienced in the tropical Pacific Ocean, which is the warm phase of periodic changes in sea surface temperature. It starts around Christmas (hence the name El Niño, Spanish for the baby Jesus) and lasts usually 9-12 months, occasionally reaching up to 24-36 months. During this period, the trade winds break up, convective activity increases in equatorial tropical climates (with heavy rainfall), the pressure differential between the eastern and western Pacific basins decreases and warming seawater leads to more intense hurricane and typhoon formation in the eastern Pacific basin. More water vapor will then flow toward the Northern Hemisphere via conveyor belts due to greater evaporation.

Figure 2: Sea surface temperature anomalies and water flow direction during the normal (top), El Niño (bottom left) and La Niña (bottom right) phases. Source: Soumi Mitra
La Niña is the opposite of El Niño. It occurs when sea surface temperatures in the eastern equatorial section of the central Pacific Ocean are 2-7 degrees Celsius below normal. The phenomenon starts when trade winds blow warm surface/near-surface waters from South America toward Indonesia. As this warm water moves westward, cold water from the deep see rises to the surface (cold thermocline zone* upwelling) near South America. The movement of this much heat across a quarter of the Earth can have a significant impact on the weather of the entire planet. While La Niña generally persists for a few months, in certain periods this can extend to several years, such as the current phase between 2020 and early 2023.
If water temperature deviation from the climate norm is below 0.5 degrees Celsius, ENSO conditions are considered neutral. Neutral conditions are the transition between the warm and cold phases of ENSO.
Transition phases at the beginning and end of El Niño and La Niña can also be important factors influencing global weather. In both cases, short-lived extremes can occur in the Americas; for example, in North America most F5 tornadoes occur during transition phases.
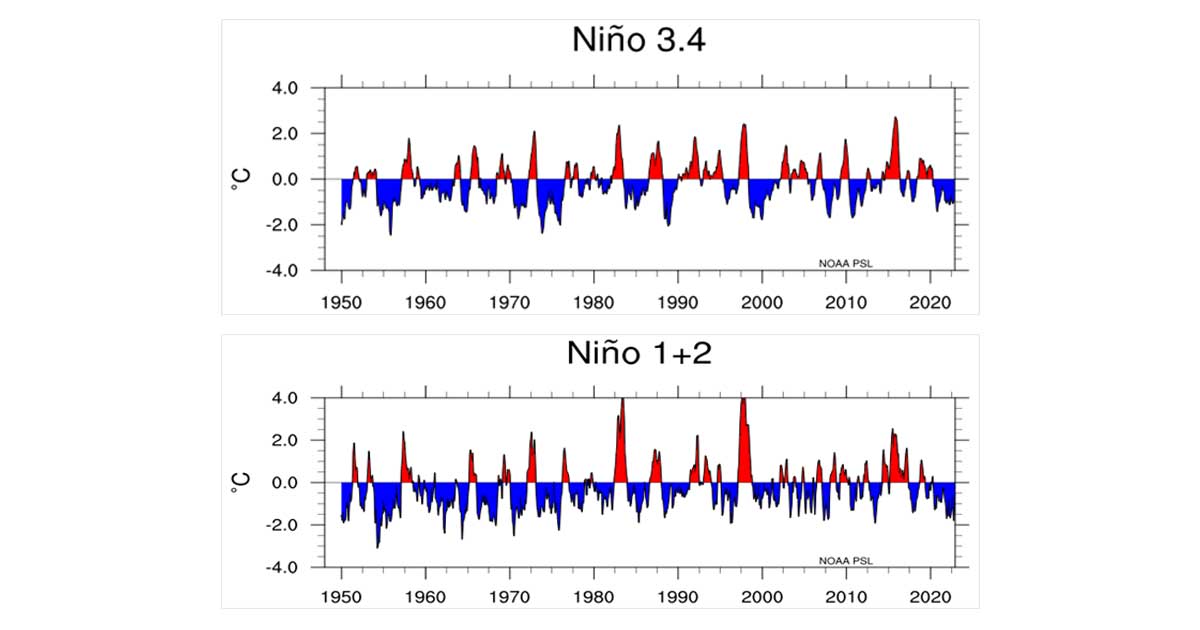
Figure 3: Anomaly of the mean ocean surface temperature in the East Pacific (Region 3.4) and off the coast of Peru (Region 1+2). between 1947 and December 2022. The color red indicates the El Niño phase, while blue signals La Niña and the normal phase. Source: PSL NOAA
II. Global and regional weather patterns
The direct impact of ENSO is largely experienced by developing countries on the shores of the Pacific Ocean. Although effects are strongest in South America and Australia, the process can have an impact anywhere in the global atmospheric system depending on is length and strength of activity. During an extraordinarily strong El Niño phase, up to 15-20 percent more water vapor is able to reach the westerly wind belt due to increased marine evaporation. In the El Niño period, water balance in the Amazon basin rises slightly due to above-average precipitation.
The most significant global and regional anomalies during El Niño are the following:
- Extreme drought from June to early September; weakened monsoon in the Deccan Peninsula (India)
- Warmer-than-average and significantly dryer-than-average weather in central and southern Africa between December and February, with wetter weather in the eastern part of the continent
- Drought and severe heat from June to August in Central America
- Average temperatures up to 7-12 degrees Celsius warmer than average across much of South America from June to August
- Strong convection and heavy storms in Oceania and the central Pacific region
- Weather in Australia is cooler and dryer than average due to blocking anticyclones
- Summers in the western and midwestern areas of North America are wetter than average
- Winters in North America, especially Alaska, are milder than average
- Wet and cooler-than-average weather in the Gulf of Mexico and the southeastern United States in the winter
- Intense, above-average precipitation in western Asia and the Urals between November and April
- Fewer tropical cyclones in the western Pacific basin, with widespread rainfall deficits throughout the year
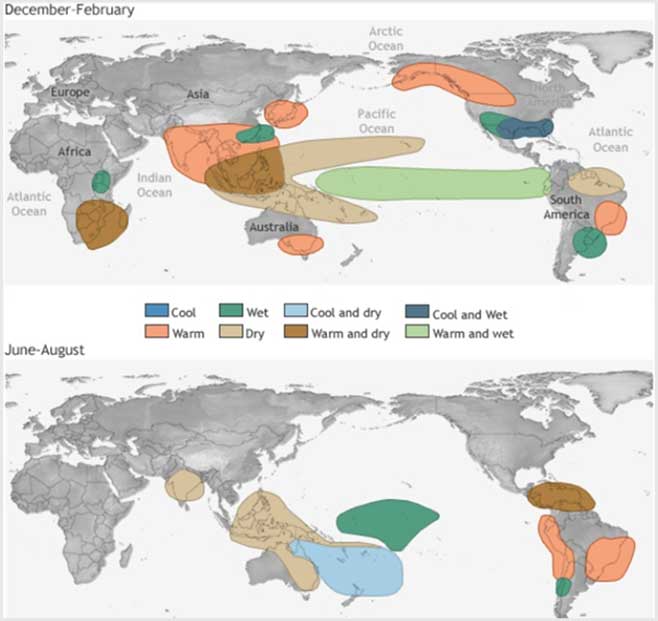
Figure 4: Average El Niño effects by region. Source: WMO
Observations carried out since 1950 show that effects associated with La Niña events are seasonal. As with El Niño, there is a medium correlation between certain weather patterns and La Niña; however, if it is persistent over a longer period or extremely severe, the correlation is moderately strong. There is a medium correlation between a persistent water vapor deficit in the westerly wind belt and La Niña if the phenomenon remains constant for at least 24 months.
The most significant global and regional anomalies during La Niña are the following:
- Dry and warm winters in Central America, especially Mexico and the Bahamas
- Tropical areas of the Pacific are cool and much drier than average throughout the year
- New Zealand and Australia are extremely warm between June and August, while Tasmania experiences heavy rainfall
- Intensified monsoon in India and floods in southeast Asia
- Summers in western Africa are cooler than average
- Winters in North America are far colder and wetter than average, with above-average snowfall
- Weakening polar and subtropical jet stream** in the Northern Hemisphere (medium correlation)
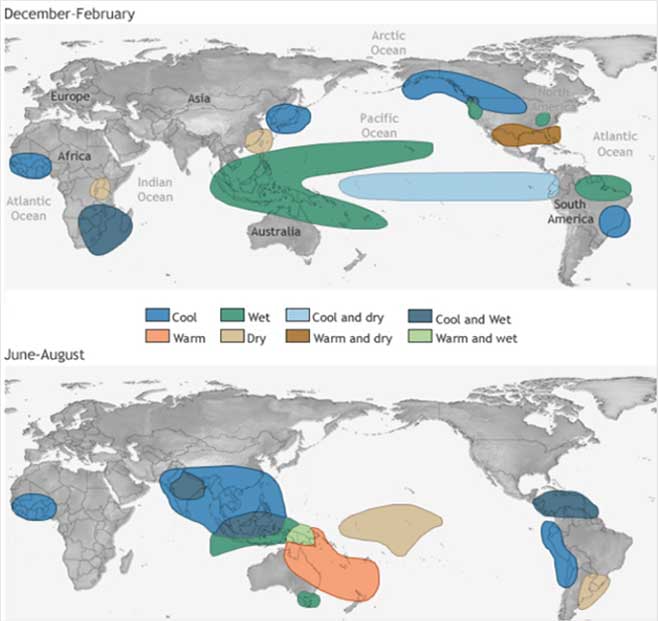
Figure 5: Average impacts of La Niña by region. Source: WMO
III. Weather in Europe during El Niño and La Niña
Europe’s weather and longer-term climate is not directly affected by ENSO in the Pacific. So far, no strong link has been found between normal ENSO effects and European weather patterns. However, if they are stronger than average, i.e. if they are more anomalous in the Pacific or if they do not start waning for a sustained period of 24-36 years, they are capable of influencing the circulation processes that impact Europe’s weather. Examples include the summer of 2022 and the winter of 2022/2023.
In Europe, much of 2021 and 2022 was much warmer and drier than average due to extreme La Niña, climate change and weakening jet streams. In particular, lack of precipitation caused problems because there was insufficient evaporation in the Pacific and the already moisture-deficient northern temperate climate belt did not get enough water vapor through conveyor belts. What did arrive was insufficient to saturate due to very high temperatures (the higher the temperature, the more water vapor is needed for condensation and cloud formation).
Similarly to a strong greenhouse gas, the accumulated but insufficient unsaturated water vapor in the atmosphere has triggered further increases in heat and drought. La Niña alone, of course, was insufficient for this; other macro-circulation and climate processes, such as persistent and sharp jet stream oscillations or a gradual rise in ocean temperatures, were also needed.
The impact of extreme El Niño can be observed in Europe in the weather patterns during the fall and winter months, especially in November, when above-average precipitation but warmer-than-average weather prevails over much of the continent. However, the Scandinavian region remains drier than average (Figure 6). During extreme El Niño periods, rainfall is normal in central Europe, summers are cloudier than average in the Mediterranean, with much less rainfall over the British Isles and the Germanic Plain. In extreme La Niña periods, summers are drier than average over most of Europe, especially in the southern, central and eastern regions of the continent; in extreme El Niño phases, the northwestern and northern regions are drier than average due to active Mediterranean cyclone formation.
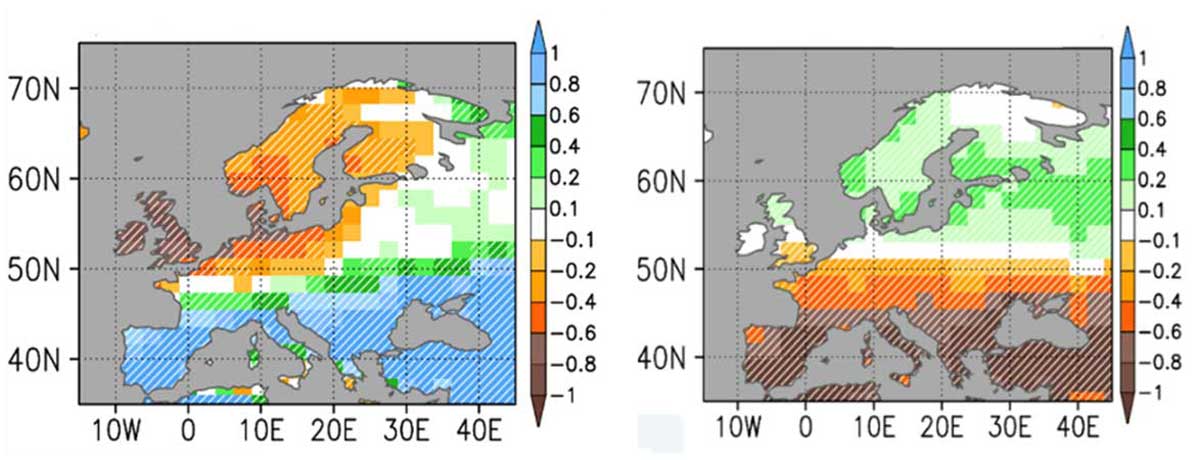
Figure 6: Impact of extreme El Niño (left) and La Niña (right) on summer precipitation levels in Europe. White bands are significant at the 95 percent level. Source: King et al., 2020
It has been observed that the polar jet stream makes more waves during extreme La Niña periods than in the El Niño phase. North American winters are therefore much colder and snowier during La Niña than during El Niño. In Europe, zonality and the Azores High anticyclone pick up strength in the winter, resulting in milder and wetter winters and colder-than-average temperatures in the Scandinavian Peninsula.
IV. Will extreme weather in Europe continue in 2023?
As a result of climate change, the winter, spring and fall seasons have become significantly milder and summers are much warmer on the old continent. 2023 is also expected to be among the hottest years on record due to intense warming, with extremes varying from region to region.
It is currently extremely difficult to predict what weather can be expected season by season in 2023. What is already visible is that the precipitation deficit of the last two years is decreasing due to cyclone activity. Mediterranean cyclone formation and zonality has also strengthened, with continue temperate cyclone genesis on the Atlantic. As a result, soils are beginning to recharge fully with moisture, and if the wet period persists into the spring, even a hot and dry summer is likely not to lead to the severe drought seen in 2022.
In early 2023, La Niña weakened further. Although ENSO is likely to enter a neutral phase in February, there is still a 10-15 percent chance that La Niña will persist (Figure 7). The reason for this is that climate change is causing the western basis of the Pacific to warm more than the eastern basin and it is becoming more difficult for large amounts of warm water to move eastward and replace high-depth cold water. However, most model calculations predict a 45-46 percent chance for a strengthening El La Niño from the late summer or the early fall. It is almost certain that ENSO will not have a significant impact on European weather this summer; however, it may possibly influence the winter movement of the jet stream, which is a major determinant of weather in Europe in that season.
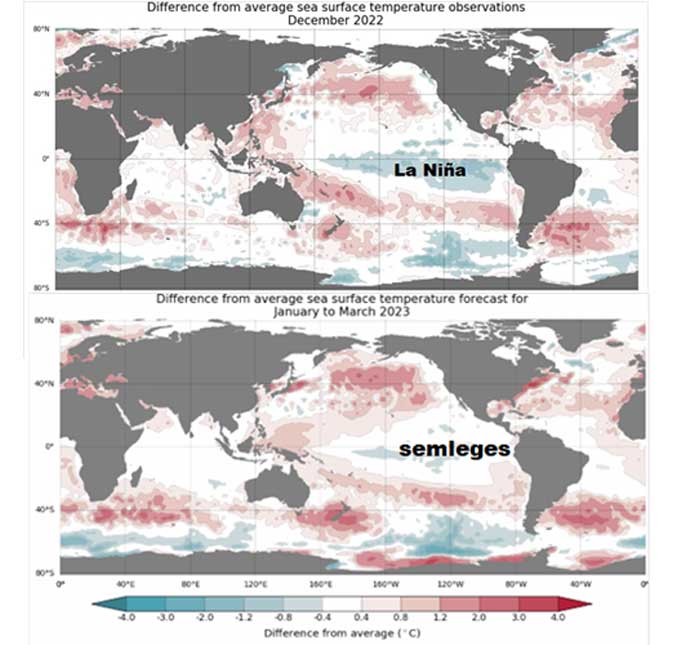
Figure 7: Anomaly of water temperatures of seas and oceans between January and March 2023 according to the prognosis of the Australian Meteorological Bureau (bottom) and measured temperatures. Source: Own work based on http://www.bom.gov.au/climate/enso/
Bibliography and online sources
Cai et al. (2015): Increased frequency of extreme La Niña events under greenhouse warming. Nature Climate Change, doi.org/ 10.1038/nclimate2492
Geng, X. et al. (2017): Strong sub-seasonal wintertime cooling over East Asia and Northern Europe associated with super El Niño events. Sci. Rep. 7, doi.org/10.1038/s41598-017-03977-2.
King et al. (2020): Impact of strong and extreme El Ninos on European hydroclimate. Dynamic Meteorology and Oceanography, doi.org/10.1080/16000870.2019.1704342/
Koós, G. (2019): Az ENSO-fázisok hatásai globális és regionális skálán. Manuscript, ELTE
McGregor, G., Ebi K. (2018): El Niño Southern Oscillation (ENSO) and Health: An Overview for Climate and Health Researchers. Atmosphere, doi.org/10.3390/atmos9070282
Rousi et al. (2022): Accelerated western European heatwave trends linked to more-persistent double jets over Eurasia. Nature doi.org/10.1038/s41467-022-31432-y
http://www.bom.gov.au/climate/enso/outlook/
https://www.climate.gov/news-features/blogs/july-2022-la-ni%C3%B1a-update-comic-timing
https://www.met.hu/ismeret-tar/erdekessegek_tanulmanyok/index.php?id=3200&hir=A_2022-es_rendkivuli_szarazsag_fizikai-meteorologiai_hattere
https://www.met.hu/ismeret-tar/erdekessegek_tanulmanyok/index.php?id=3212&hir=A_viz_korforgalma_a_legkorben_%E2%80%93_a_rendkivuli_aszaly_idojarasi_hattere
https://klimapolitikaiintezet.hu/cikk/aszaly-klimavaltozas
https://www.pmel.noaa.gov/enso
https://psl.noaa.gov/enso/
https://www.jpl.nasa.gov/news/nasa-estimates-the-global-reach-of-atmospheric-rivers
https://www.weather.gov/jetstream/enso_impacts
https://wildlife.ca.gov/Conservation/Marine/El-Nino
https://public.wmo.int/en/about-us/frequently-asked-questions/el-ni%C3%B1o-la-ni%C3%B1a
https://public.wmo.int/en/media/news/2023-warm-start-breaking-records-across-europe
* The layer of the ocean where the water temperature drops suddenly. In most oceans, including tropical seas, it begins at a depth of about 100 m, just below the surface layer stirred up by wind, where sea surface temperatures can reach 28 degrees Celsius. It extends to a depth of about 1000-1200 m, where the temperature is only 2 degrees Celsius. In some oceanic areas, e.g. the North Atlantic, intermittent warming can produce an intermittent thermocline above the permanent deeper thermocline.
** A west-to-east stream in higher altitudes of the atmosphere, in the middle and upper troposphere at mid-latitudes. Its speed is at least 30-40 m/s. In general, low-pressure areas near the ground follow the direction of this flow in the mid-troposphere (at about 5000 m), with a speed of about half that of the base flow.